Free supply and demand zones indicator for NinjaTrader 8
A demand zone is where price left with force to the upside: buyers overwhelmed sellers and, according to Sam Seiden's school, unfilled orders were left behind. A supply zone is the same to the downside.
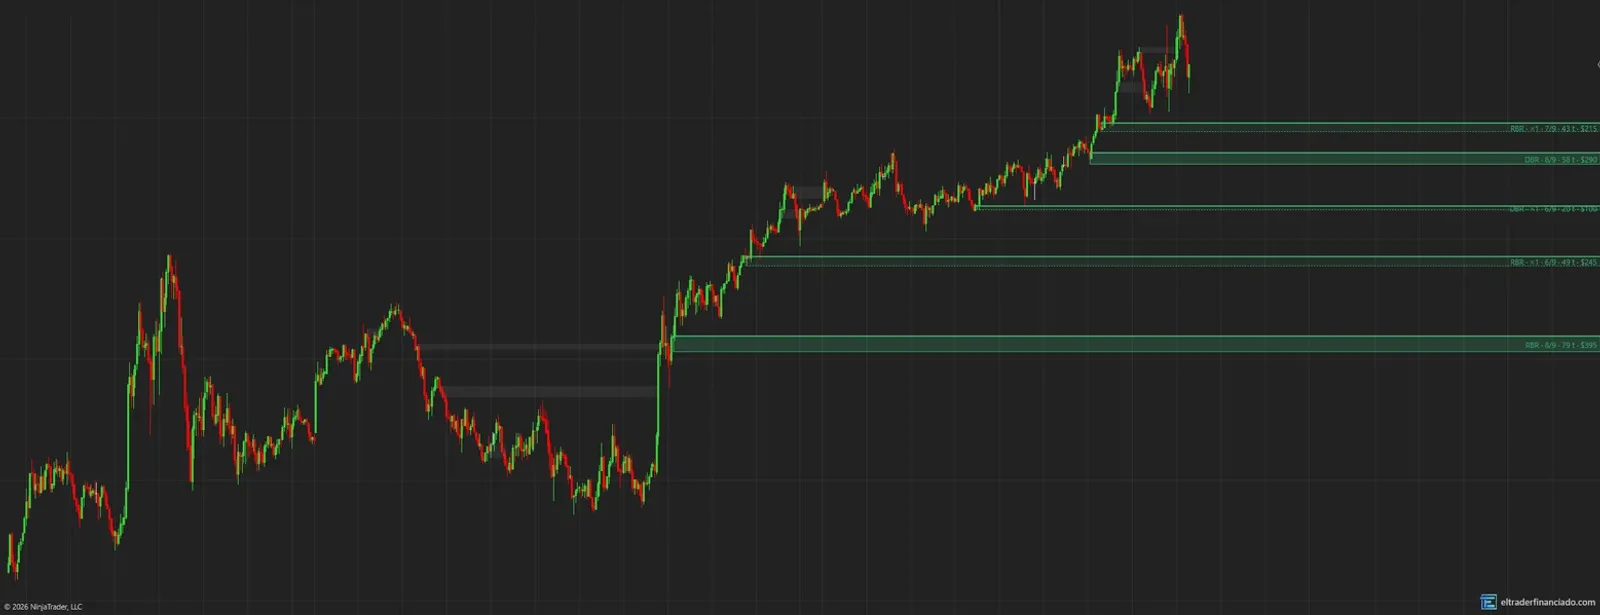
This indicator marks them with fixed rules, tracks how many times each was touched and shows what a stop behind each zone costs in dollars per contract.
- 100% free
- Open source (MIT)
- Built by El Trader Financiado for the community
Version 1.0 beta · NinjaTrader 8 · .zip to import · also in the pack of all 8
Install one language only: if you switch between English and Spanish, delete the ElTraderFinanciado folder first (Documents\NinjaTrader 8\bin\Custom\Indicators).
What the indicator draws
- Demand zones (RBR, DBR) and supply zones (DBD, RBD): a base of 1 to 6 indecision bars followed by a strong leg-out measured with ATR.
- Fresh zones with a strong fill; tested ones fainter with a dashed border and "×n". After the third touch the zone is retired.
- A 0-9 score broken down into freshness, leg-out strength, base bars and room to the opposite zone.
- Risk per contract: zone height in ticks and in dollars.
- The 5 nearest live zones per side; broken zones stay gray for one day.
How a supply and demand zone is marked
You look for a base: one or more small indecision bars. Then a leg-out: big bars moving away with force. The base is the zone.
Read the full guide: what it is, rule-based strategies and common mistakesHow to trade supply and demand zones
A summary of the most common uses. Entry, stop and target rules are in the guide.
First touch of a fresh zone
The classic rule: the best zone is the one price hasn't revisited yet.
Origin zone of a big move
The base a strong rally or drop came from is the most watched one.
What the evidence says
The method was popularized by Online Trading Academy, which the FTC sued in 2020 over earnings claims. Carol Osler's study (Federal Reserve Bank of New York, 2000) found bounces at 60.8% of published levels versus 56.2% at random levels, without proving profitability. The indicator's score summarizes the classic criteria; it is not a win probability.
Key settings
| Setting | Default | What it does |
|---|---|---|
| Exit strength (× ATR 14) | 1.5 | Higher = fewer, cleaner zones. |
| Max zone height (× ATR 14) | 1.0 | Lower = tighter zones. |
| Zones per side | 5 | The nearest to price. |
| Max distance (× ATR) | 0 (never) | Raise it to retire far-away zones. |
| Proximal edge | Body | On the base bodies or wicks. |
How to install ETFOfertaDemanda in NinjaTrader 8
- 1
Download the .zip and don't unzip it.
- 2
In NinjaTrader 8, from the Control Center: Tools → Import → NinjaScript Add-On… and pick the .zip.
- 3
Accept and wait for it to compile. If you had an earlier version, allow it to overwrite.
- 4
On the chart: right-click → Indicators… → ElTraderFinanciado folder.
Frequently asked questions
Is the score the probability that a zone works?
No. It summarizes the classic school's criteria (freshness, leg-out, base and room). No study has validated that score.
Do the zones repaint?
No. A zone appears on the bar that confirms the leg-out and touches count from the next bar. The only later change is its size, if it merges with a nearby zone on the same side.
Why do I see few zones?
Check "Max distance" (0 = never retired by distance) and "Zones per side". If you updated from an earlier version, remove the indicator and add it again to load the new defaults.
Trying it in a futures prop firm?
We have discount codes for the main evaluations. They are affiliate links: we earn a commission if you buy through them.
More free indicators
Market Structure & Order Blocks
FreeBOS, CHoCH and MSS with real displacement, and the active order blocks behind each break.
Volume Profile
FreeSession volume profile with POC, value area, naked POCs, HVN/LVN nodes and fixed ranges.
These indicators describe what price has done; they don't predict what it will do and they are not investment advice. Only trade futures with money you can afford to lose.