Free CRT indicator for NinjaTrader 8
Candle Range Theory starts from a simple idea: the range of a 4-hour candle is liquidity. When the next candle sweeps its high or low and closes back inside, price tends to travel to the other side of the range.
This indicator builds the 4-hour candles on your execution chart, detects every CRT and tracks its targets during the following candle.
- 100% free
- Open source (MIT)
- Built by El Trader Financiado for the community
Version 1.0 beta · NinjaTrader 8 · .zip to import · also in the pack of all 8
Install one language only: if you switch between English and Spanish, delete the ElTraderFinanciado folder first (Documents\NinjaTrader 8\bin\Custom\Indicators).
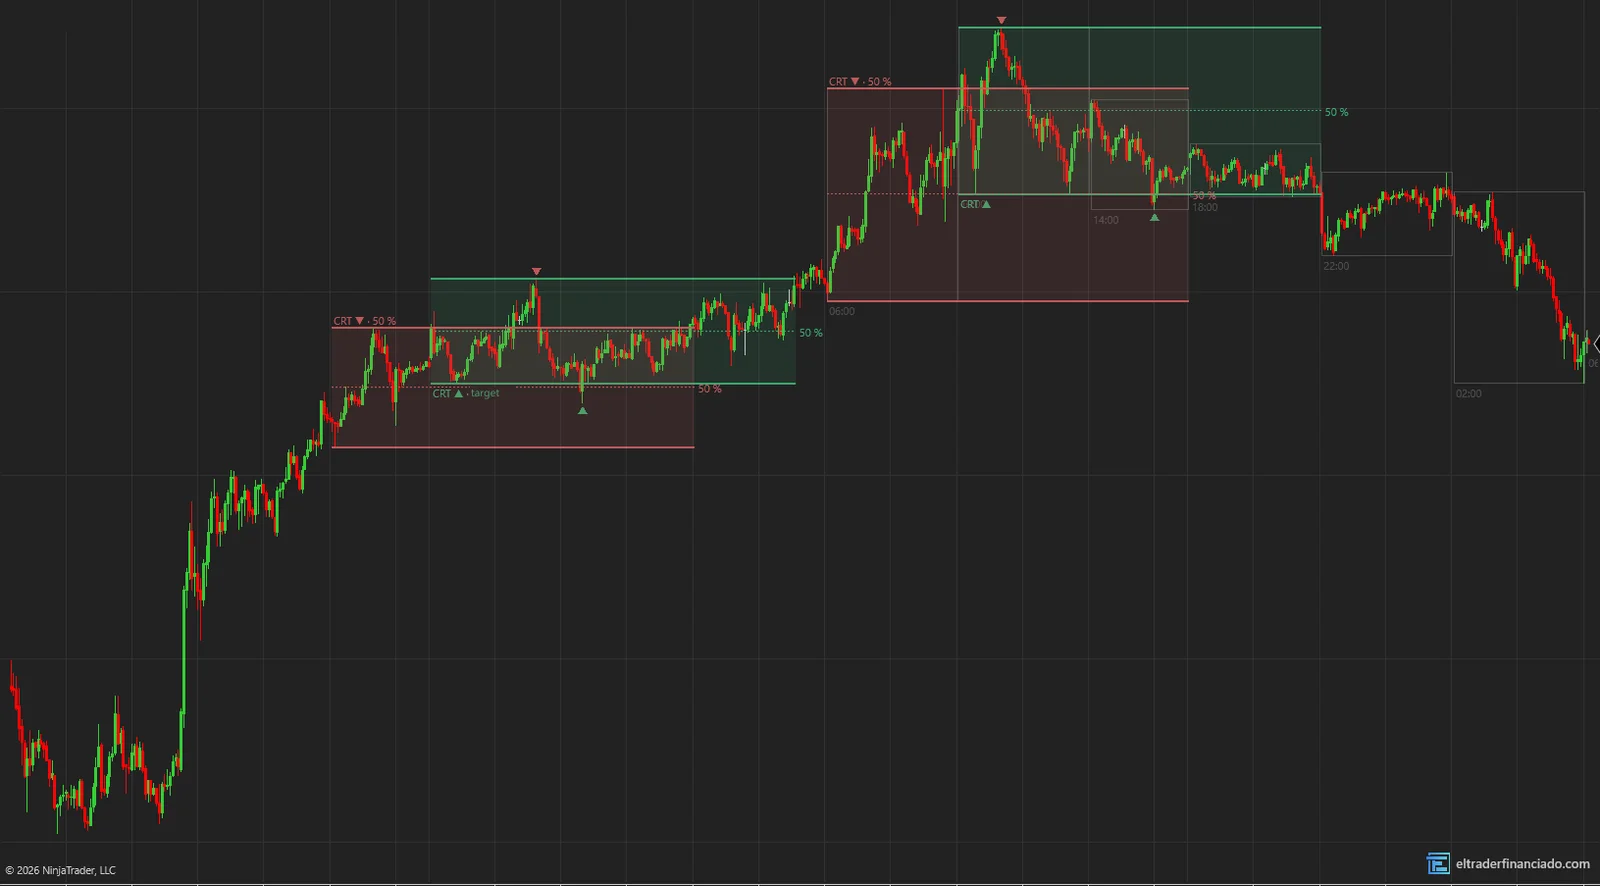
What the indicator draws
- The last 6 four-hour candles in gray, aligned to 02:00, 06:00, 10:00… New York like CME's (or 01/05/09, 1H or daily).
- Every confirmed CRT: the reference candle's range, its 50% and a triangle on the sweeping bar.
- The state of each CRT during the following candle: 50% reached, target hit or invalidated.
- A provisional CRT while the sweeping candle is still open.
- Optional Turtle Soup, the classic pattern CRT is a variant of.
What Candle Range Theory is
CRT compares two consecutive higher-timeframe candles. The first is the reference: its high and low define the range. The second sweeps one extreme and closes back inside.
Read the full guide: what it is, rule-based strategies and common mistakesHow to trade Candle Range Theory
A summary of the most common uses. Entry, stop and target rules are in the guide.
4H CRT with a 5-minute entry
The most popular model: the pattern on 4H and the entry on a low timeframe.
CRT inside the killzone
Filter for the CRTs that form during London or New York.
What the evidence says
CRT is a variant of Linda Raschke and Larry Connors' Turtle Soup (1995). There are no public studies measuring its performance; the indicator describes it, it doesn't validate it.
Key settings
| Setting | Default | What it does |
|---|---|---|
| Reference candle | 4H 02/06/10 | CME-aligned 4H, 4H 01/05/09 NY, 1H or daily. |
| Close requirement | CloseInside | Close inside the range, or the whole body inside. |
| CRTs to show | 8 | The most recent ones. |
| Show provisional CRT | On | While the sweeping candle is open. |
| Show Turtle Soup | Off | Sweep of the N-bar high or low. |
How to install ETFCRT in NinjaTrader 8
- 1
Download the .zip and don't unzip it.
- 2
In NinjaTrader 8, from the Control Center: Tools → Import → NinjaScript Add-On… and pick the .zip.
- 3
Accept and wait for it to compile. If you had an earlier version, allow it to overwrite.
- 4
On the chart: right-click → Indicators… → ElTraderFinanciado folder.
Frequently asked questions
Why do the 4-hour candles start at 02:00 instead of 00:00?
Because the CME session opens at 18:00 New York. Counting from there, the 4-hour blocks fall at 18, 22, 02, 06, 10 and 14. If you prefer the 01/05/09 anchor, it's in the "Reference candle" setting.
Which chart should I put it on?
A lower timeframe than the reference candle that divides the hour: 1, 5 or 15 minutes for 4-hour candles.
Trying it in a futures prop firm?
We have discount codes for the main evaluations. They are affiliate links: we earn a commission if you buy through them.
More free indicators
Session Levels & Killzones
FreeICT killzones, Asia/Europe/US sessions, PDH/PDL, cash open and close, and liquidity sweeps.
Fair Value Gap (FVG)
FreeBullish and bearish FVGs with their 50% (CE), partial fills, inversions (IFVG) and higher-timeframe FVGs.
These indicators describe what price has done; they don't predict what it will do and they are not investment advice. Only trade futures with money you can afford to lose.