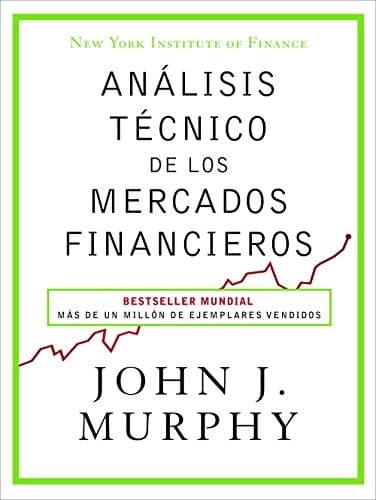
Technical Analysis of the Financial Markets
作者 John J. Murphy
Amazon 聯盟連結。使用這些連結,能在不增加你任何花費的情況下支持我們的免費內容。
重點整理
If there's one technical analysis manual almost everyone cites as a reference, this is it. Murphy gathers the classic chart-analysis tools into a single volume and explains them in an orderly way, with real examples and charts you can follow with no prior knowledge.
The coverage is complete: Dow theory, trends, support and resistance, the main reversal and continuation patterns, volume and open interest, moving averages, oscillators and indicators, and a final block on intermarket analysis — the relationship between bonds, currencies, commodities and indices. It doesn't marry a single system; it gives you the vocabulary and the pieces to build your own.
It's not an afternoon read. It works best as a reference book: you keep it within reach and go back to the chapter you need when you want to firm up a concept or review how an indicator is read. Many later courses and books start from here.
It fits best if you're starting out and want a solid, orderly base, or if you trade technically and carry gaps you never closed. It's written for stocks, futures and currencies alike, so most of it applies directly to futures.
你會學到什麼
- Reading trends, support and resistance
- Recognising the main chart patterns
- Interpreting volume, moving averages and oscillators
- The fundamentals of Dow theory and Elliott waves
- Intermarket analysis: bonds, currencies, commodities and indices
- Organising every tool into one coherent framework
推薦對象
- Beginners who want an orderly technical base
- Futures, stock or currency traders
- Those who trade technically with gaps in the fundamentals
- Anyone after a permanent reference book
- Self-taught traders who learned in a scattered way
書籍資訊
- 出版年份
- 1999
- 頁數
- 552
- 出版社
- Gestión 2000
- ISBN
- 9788498754285